 We're now part of the Cadmium product suite! Learn more
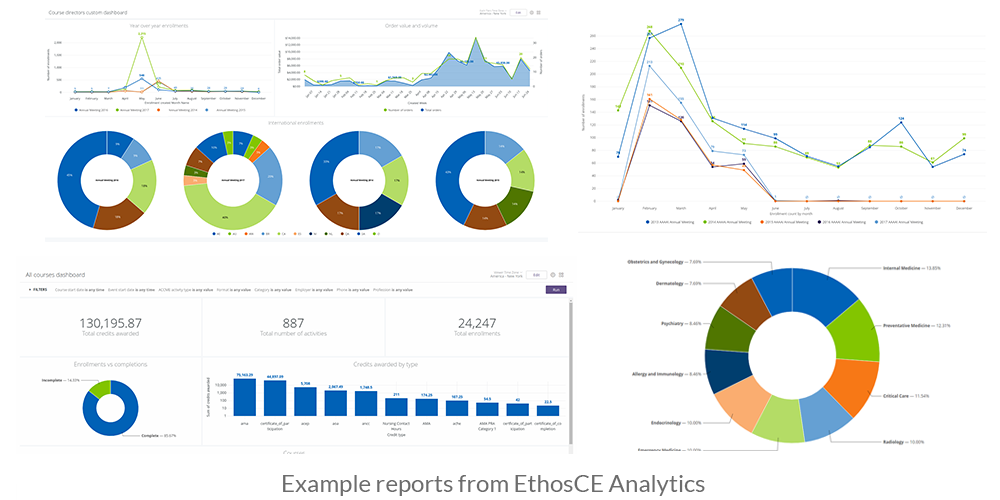
EthosCE Analytics Spotlight: Modern User Engagement Visualization

Data visualization is a tool that can improve every aspect of your CME program—including user engagement. Why? Because graphic data visualizations bring critical insights to life from raw data—allowing CME directors to easily view learner engagement patterns and incorporate findings into curriculum strategy.
Your educational outcomes are only as good as your analytics
Without self-serve analytics (such as the EthosCE LMS platform offers), your decision-making process will be based on guesswork and the data that you have time to gather and review. Your findings may be corrupted by human error if its manually collected, and you may miss critical insights that may change your outlook on the right next steps for your program.
With EthosCE, your data collection process can be completely automated. That means no more scrolling through a seemingly endless backlog of spreadsheets and pasting statistics into emails. The EthosCE Analytics suite pulls data directly the LMS and other selected third-party sources. With our platform, you have complete control over your data, through our customizable dashboards accessible through the main admin panel.
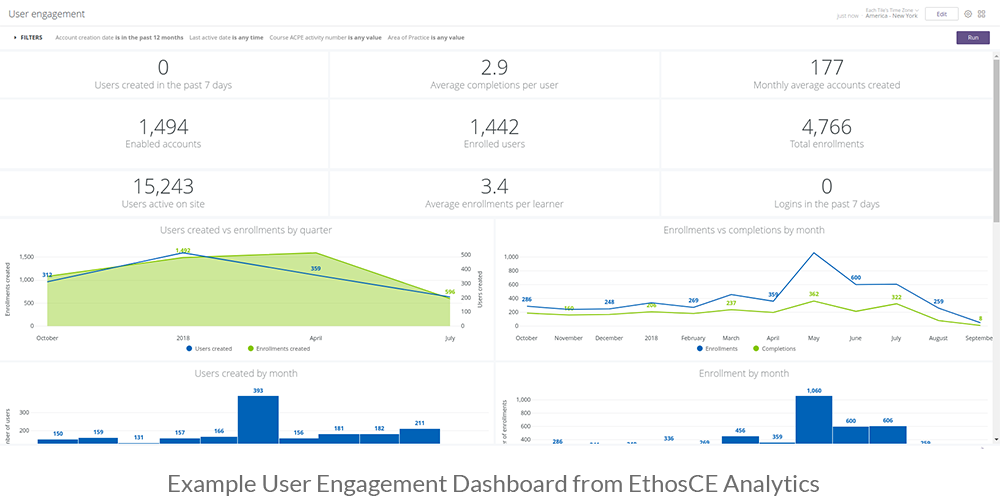
EthosCE Analytics dashboards allow you to view historical and real-time program data with a glance. Our advanced notifications feature lets you customize alerts so that whenever a change occurs in your data, you and your designated team members are the first to know. That means that as you build marketing strategy or create new activities content, you will always have the data-driven insights that you need to improve educational outcomes. Learn how to segment your data correctly.
How Data Visualizations Demystify User Engagement
Advanced data visualizations allow you to accurately map the current state of user engagement in your program. CME directors can use data visualization to present detailed user engagement data and determine how to enhance educational outcomes for existing users and inspire new registrants.
With data visualization you can:
- Summarize a series of datasets on a single page
- Reveal causal relationships between learner outcomes and behaviors simply
- Highlight the best use of educational resources based on improving course outcomes
- Review the impact of changes in course content on program global learner performance
- Present evidence of benchmark achievement across your organization
- Identify weaknesses in specific pieces of educational content based on learner performance
- Discover the categories of at-risk learners who need the most help
These are just some of many options available to you when you can use visualizations to present complex program data.
When program data is easy to access, analyze and share, it is simple to update your CME strategy to reflect your findings on learner engagement.
Data Visualizations Highlight the Data You Need to Build Strategy
It is important to be aware of the key indicators of sustained member engagement and how communication of this data can guide curriculum and strategy. Here are just a few examples of data sets to monitor:
- Learner assessment scores before and after changes to curriculum content. A decline student performance may indicate that your content is poorly suited for your many of your users’ learning styles.
- LMS engagement times for new and returning students. If learners are frequently pausing activities or not returning after significant periods of time, your content may not be user-friendly.
- Current learner email responsiveness. Students who are not responsive to emails could have become disinterested in their course and may be at risk of dropping out.
- Positive and negative learner feedback regarding course content over time.Your users’ individual perceptions of their experience with your content will determine their sense of engagement with the material.
- User experience-related support ticket requests. If you have many students who submit support tickets regularly, then you may need to improve your onboarding process. These students may be at risk of dropping out.
- Course completion rates segmented according to demographic or other learner attributes. Users who belong to learner categories that often face unique challenges with certain courses (such as new doctors learning advanced topics for the first time) should be identified and targeted for early intervention before they disengage with the material.
- Self-reported educational outcomes improvement during your CME program’s timeline. Review the bulk of your self-reported educational outcomes data and compare it with your latest analytics to determine if learner engagement is improving.
Simplify Learner Engagement Strategy with Data Visualization
Data visualizations eliminate the need for long reports that waste words (and time) describing data that can be easily summarized. EthosCE combines advanced business intelligence with the ease of self-serve analytics, allowing CME directors to have constant access to the user engagement insights that they need to improve educational outcomes.
Here’s what we know:
Learner engagement modeling is the best way to improve curriculum strategy and overall educational impact. Engagement data is an important foundation for effective curriculum and marketing strategy:
- A visualization of incomplete data is useless: with EthosCE CME directors have instant access to accurate historical and real-time data.
- Our management suite eliminates data gaps and the prospect of human error in data gathering by automating data collection.
- EthosCE Analytics makes advanced analytics accessible to organizations of every size, allowing CME directors to view aggregate and granular insights via customizable dashboards in the LMS admin panel.
Ready for a roadmap to deeper learner engagement? We’d love to show you what your data can do for you.
EthosCE is designed specially for medical CE, with over 16 years of experience in the field. We’ve helped many associations and universities make the switch to our easy-to-use LMS.
Connect with us today to learn more about connecting powerful User Engagement Visualization and strategy with a 1-on-1 demo with EthosCE Today!