 We're now part of the Cadmium product suite! Learn more

It wouldn’t be an exaggeration to say that you may have more data than you can use—but you know better than to take the short view. You know that your data—learner outcomes, feedback, course completion rates—are vital to your decision-making process. The accuracy of your reporting determines how effective your strategy is, and if there’s a way to make the data collection and analytics process more efficient and less error-prone, you’ve probably researched it.
The Right Data Isn’t Enough
If you aren’t using an enterprise-grade analytics suite, then you might be surprised to learn that having a firm handle on your data isn’t enough. With an advanced analytics suite, you can go far beyond the numbers to map causal relationships between key components of your CME program—such as curriculum content changes and learner outcomes. That’s vital if you are seeking to prepare for an accreditation or reaccreditation process or even if you are just beginning to test new content. A robust analytics toolset, such as EthosCE Analytics, allows you to easily connect the dots between cause and effect, granting you access to historical and real-time data and helping you discover the patterns that reveal course management problems and solutions.
Slicing Your Data the Right Way
Slicing your data means creating data segments that can be analyzed individually and in aggregate. Doing it correctly? That’s a bit more involved. First, let’s narrow the focus of your research. Here are a few tips to creating better data segments.
What Your Data Can Reveal About Learner Outcomes
The insight that you derive from your data the most important diagnostic tool in your decision-making process, enabling you to pinpoint areas where the presentation of activities content (or the curriculum itself) is at risk of derailing your students’ learning experience. When attempting to discover reasons for an unsatisfactory trend in learner outcomes, make a practice of slicing your data with a focus on potential relationships between data sets. Here are a few examples:
Learner Assessment Results and Activities Content Impact
Take a look at:
- Scoring patterns before and after changes in curriculum content;
- Test scores segmented by years of relevant professional experience;
- Assessment results sliced according to self-reported user familiarity with the LMS platform or online learning in general
Questions to ask:
- Are veteran medical professionals doing significantly better with new concepts than learners new to their profession?
- Are there improvements in overall learner outcomes at each stage of an activity when examined over time?
- At which point are experienced and newer medical professionals achieving the same levels of knowledge retention when introduced to new material?
Insights:
- Look for content within activities or learner assessments that presumes a certain level of professional experience. This content can impact course completion rates in the future, especially as your program grows and new learners explore your course options.
- Consider creating a new course or activities track geared toward young professionals, or retool your content to be more accessible to learners with diverse levels of experience.
What Data Can Reveal About Course Completion Patterns
One of your biggest challenges in maintaining a thriving CME program is insuring that course completion rates remain high. If your students are dropping out of your program in significant numbers, it’s easy to assume that it’s just the nature of the beast—online and even hybrid-learning courses have traditionally had low completion rates in every corner of academia. However, digging deeper into the reasons that your students may be leaving can help you reverse not only the trend but also strengthen your program’s appeal to the students who need your program most.
Course Completion Rates and User Support Ticket Requests
Take a look at:
- User support ticket requests from high-performing learners who left their courses before completion
- Helpdesk requests from struggling learners who left their courses even after showing improved scoring
- Course completion rates for learners with significant preexisting knowledge of the course subject matter and learners who wish to address specific knowledge gaps
Questions to ask:
- Based on learner feedback, are professionals with a solid grasp of course content leaving because of unresolved issues with our learning platform?
- According to support ticket data, have I lost students because the content is structured poorly and hard to navigate?
- Are the students with the greatest motivation to learn—those seeking to build specific competencies as a response to a professional intervention—losing faith in our platform because of content that fails to address their educational needs?
Insights:
- If your strongest students are leaving your course before receiving their certificates, then a record of their support ticket requests gives you meaningful insight into the reason why their frustrations got the better of them. You may find that it is a user-experience issue—such as a hard-to-navigate activity—that is driving them away.
- Learners with the most to lose by leaving a course early—those tasked with developing specific professional competencies—could be abandoning your program because of poor user experience and content that failed to address their knowledge gaps.
- If you are using a full-featured analytics suite, then you can easily compare support ticket request data with course completion rate findings. Consider adding links to your FAQ or on-page self-help buttons to help users navigate multi-tiered material.
- If you have a sizeable group of students who are taking your course as a response to educational intervention, it might be wise to consider creating add-on activities for these learners with targeted content designed to reinforce essential concepts.
Slicing Your Data the Easy Way
As a CME director, your data is your weapon against the biggest roadblocks to your program’s growth. From content development workflow inefficiency to misallocated human resources—data-driven decision making can help you eliminate faulty operational models and fine-tune your curriculum to get the best educational outcomes for your students. When sliced correctly, your data yields the insights that you need to produce stellar results for your students and your organization consistently.
Of course, this is easier said than done if you are attempting to handle this manually. Without the ability to generate advanced data visualizations, you will have to ask your team to comb through spreadsheets and paragraph upon paragraph of summaries of statistics to imagine the big picture. With a data visualization, you can show your team that, for example:
- 70% of students scoring below 80% on their last learner assessment left the course.
- 60% of those students cited poorly worded questions and content structure on the last activity as the most critical barrier to their completing the course.
- Using advanced data visualization means a shorter path to solutions—and perhaps shorter strategy meetings.
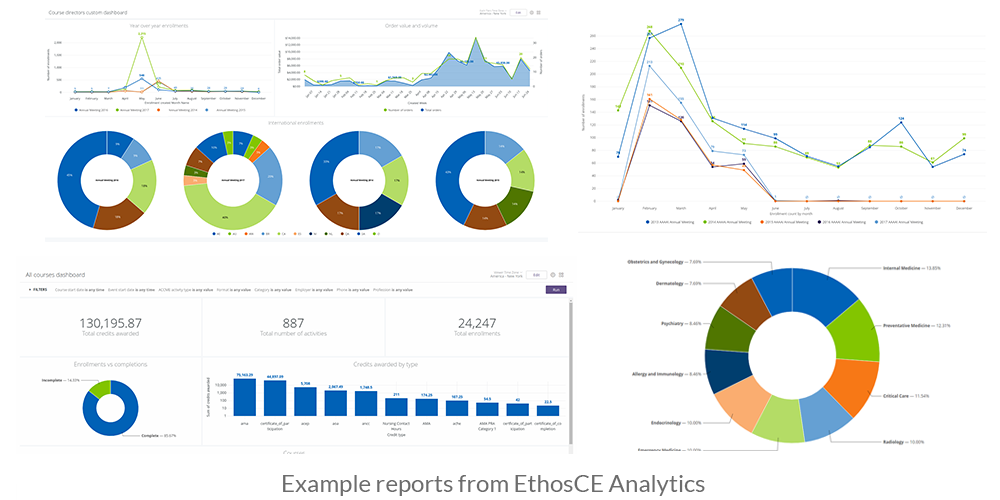
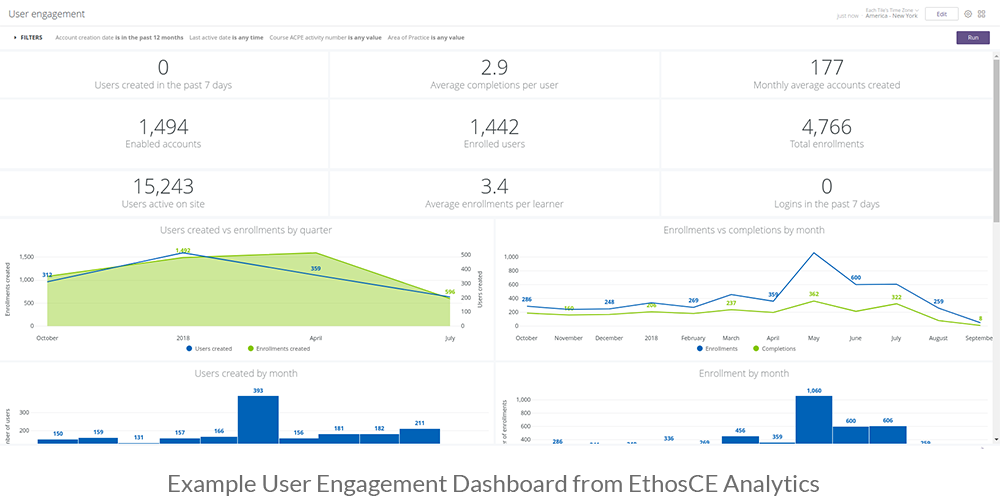
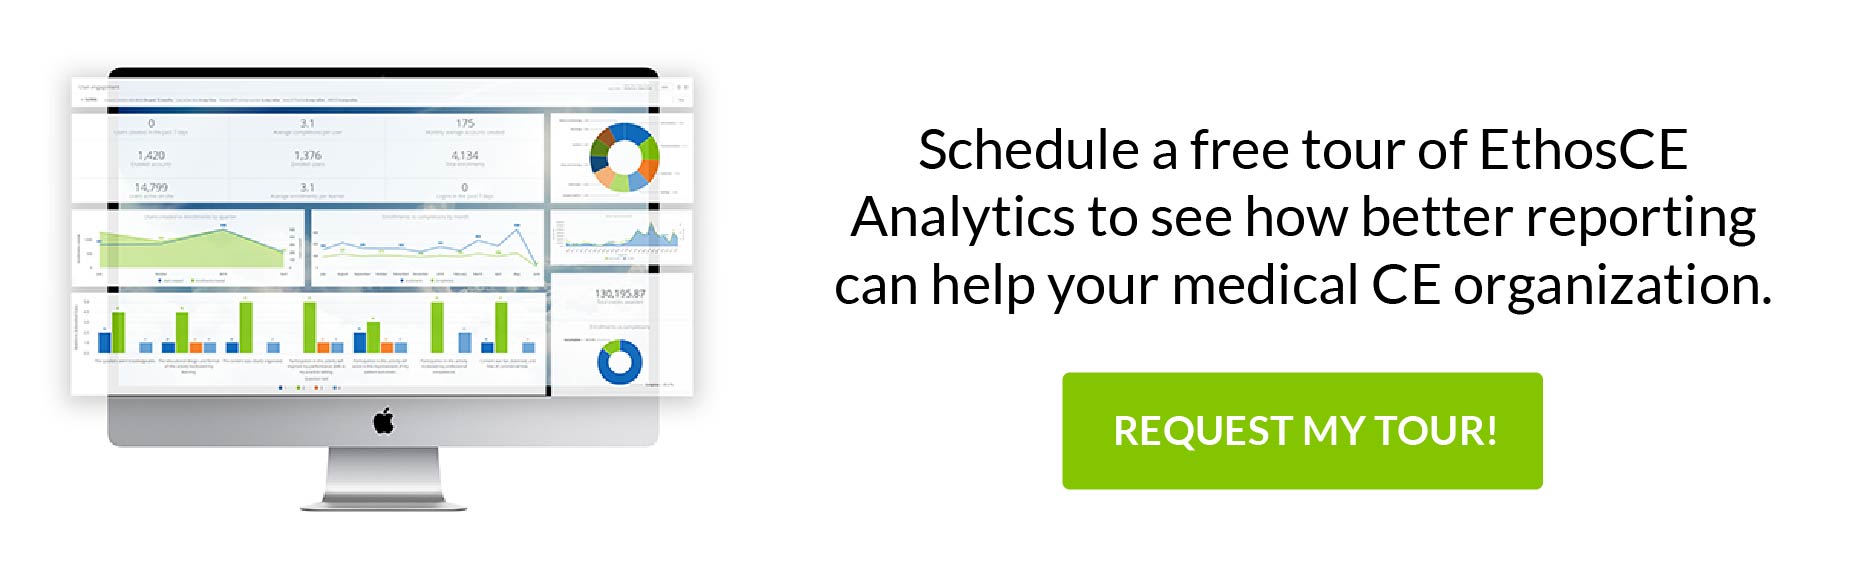
EthosCE Analytics, which comes bundled with the EthosCE CME LMS, simplifies data segmentation, analytics, and reporting for CME directors. You won’t even have to deal with manual data collection. EthosCE Analytics offers customizable dashboards that feature insights based on custom and pre-set data segments such as learner behaviors, demographics, and LMS usage patterns.
EthosCE makes status reporting effortless, with data visualizations that can be generated and shared instantly across your entire organization—presenting any pre-set or customized data set or insight that you deem is relevant. That means you’ll have actionable insights at your fingertips drawn from real-time and historical data—turning weeks of work into a matter of a few clicks.
For more than 16 years, EthosCE has made enterprise-grade CME management features available to organizations of any size. We offer access to best-in-class analytics tools that do the heavy lifting for you—allowing you to “set and forget” the data segments that you want to keep tabs on and generate comprehensive reports on patterns in educational outcomes, learner behaviors, and user experience (among other datasets), at will.
Ready to see how to get the most out of your data? Connect with us for a demo.
[…] for example, your data is accessible through a series of customizable dashboards. You can slice your data the way you want, view aggregate or individual learner data sets historically or in real-time, then […]
Comments are closed.