 We're now part of the Cadmium product suite! Learn more
Improving Learner Satisfaction Through Data Visualization

You’ve meticulously structured your course activities to optimize the value of every moment that your students spend online. You’ve developed a solid, evidence-driven curriculum designed to provide a consistently exceptional learning experience. You haven’t let your standards for user experience slip or neglected to keep up with the latest educational best practices. Yet regardless of how hard you’ve worked, or how well your students are performing, you—like any other dedicated CME director—will ask: “How can I keep improving learner satisfaction?”
How Graphic Visualizations Unlock the Power of Your Data (and Help You Keep Improving Learner Satisfaction)
If you’ve wrestled with the question of how to keep improving learner satisfaction, then you know that the clues won’t be revealed with guesswork. Here are five tips to help you get the clearest portrait yet of your learners’ needs.
Go back to square one—your data.
Even the most sophisticated engagement strategy won’t impact your learners unless it’s data-driven. You need to know who your learners are before you can determine what they need educationally.
Build an innovation engine based on evidence.
With the right data, you can improve learner satisfaction by implementing changes based on learner feedback and patterns in their LMS interactions.
Get all of the data that matters to your decision-making process—a limited view of your program means limited insights.
Uncovering the data needed to improve user experience requires access to a comprehensive analytics suite. If you aren’t using an enterprise-grade LMS, then that should be your first step.
Advanced data visualizations make everything clear with a glance.
Advanced visualizations allow you to summarize complex insights in a succinct, user-friendly format. That means that the insights gleaned from your data are now accessible and easily actionable.
With EthosCE Analytics, an enterprise-grade analytics suite that’s included with our LMS, your data is truly yours—you can view historical and real-time program data with a few clicks and generate visualizations of your data on demand.
A generic LMS may record limited information, but it won’t provide the deep insights into user experience that you need to stoke learner engagement.
A Learner Satisfaction Self-Assessment Quiz: Do You Have the Right Data Toolkit?
Do you have a simple way to determine if your learners’ educational outcomes are improving steadily over time?
Are you able to pinpoint changes in your learners’ LMS user experience based on their feedback at specific points during their course timeline?
Can you review your learner, course, and program data without manually cutting and pasting statistics?
Are PARS-compliant reporting duties spread across multiple departments in your organization? Learn how we simplify data reporting.
Does learner engagement troubleshooting take weeks because data collection is manual and data sources are diverse? Learn how our self-serve analytics model makes it easy to view critical data from multiple sources.
3 Quick Tips on How to Improve Learner Satisfaction
Organizations of any size invariably face challenges in improving learner engagement. Here are three quick tips to help you use the power of your data to transform learner satisfaction.
- User experience is a key determinant of educational outcome: make sure your LMS is optimized for medical CE. The quality of the LMS is a major factor in how well medical professionals learn within a CME program and how long they remain in their course. Look for patterns in support ticket requests, learner feedback, and course completion rates that reflect widespread dissatisfaction with the LMS user experience.
- Evaluate the impact of your activities content on learner knowledge retention frequently. As your audience of learners change, so will the efficacy of your content—you may have to alter your curriculum significantly as your students educational outcomes warrant. Check your data for changes in learner performance over time and target subject areas that your newer students are struggling with for review.
- Look to the future with long-term strategy. It isn’t enough to be certain that your learners are increasingly engaged with their courses at present. Take steps now to create data-driven “fail safes” to address dips in user engagement in the future. For example, if new content formats tend to cause a flurry in support tickets requests, introduce an on-boarding effort well in advance of any curriculum changes. Monitor your data for any signs that your learners are reacted differently than your data would predict to their user experience and adjust strategy accordingly right away.
Your learners are already motivated—it’s your LMS platform’s job to keep them that way.
Here’s what we’ve found:
- Automated data collection and management is a time-saver for CME directors, allowing them to view actionable insights.
- Access to better reporting unlocks the data CME directors need to design educational experiences that will meet the needs of their users.
- Only a CME platform created by a provider with medical CE experience can provide the flexibility and intuitive design medical professionals require from their LMS.
- User experience is often neglected in the design of generic—or non-medical CE LMS management platforms.
- Learners with poor user experience have less satisfactory educational outcomes.
At EthosCE, we believe that your LMS platform should solve your user experience and data management puzzles for you, not add to your task list.
How We Solved the CME Data Problem
EthosCE Analytics automates data collection, eliminating the prospect of missing user experience and LMS usage data. We make historical and current aggregate user data available for easy comparison through customizable dashboards, providing an accurate portrait of CME user experience.
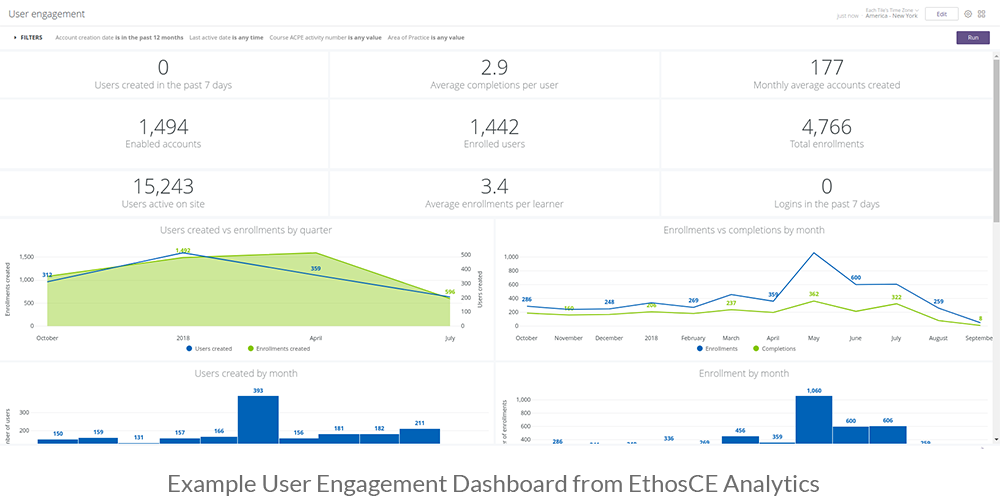
Advanced data visualizations aren’t just informative illustrations, they’re roadmaps, empowering you to uncover the patterns in your data that reveal your learners’ user experience moment-to-moment.
EthosCE Analytics data visualizations provide CME directors with a complete portrait of learner satisfaction data, empowering data-driven decision-making. Advanced data visualizations also make it easy for CME directors to share insights across their organization and make certain that learners always receive the best possible user experience.
The EthosCE platform provides enterprise-grade features within the LMS, enabling organizations of any size to scale their CME programs seamlessly. For more than 16 years, we’ve partnered with our clients in developing long-term growth strategy, helping them unlock the power of their data to transform their learners’ educational outcomes. Connect with us and let us put your data to work.
Interested in learning more about data visualization and improving your learner satisfaction? Reach out to EthoseCE today for a 1-on-1 demo & strategy session today!