 We're now part of the Cadmium product suite! Learn more
Cutting to the Chase. How to Get to Your Actionable CME Data Fast

CME data is often the elephant in the room: without it, everything from the long-term projections in the Self Study to activities designed to address learner needs will be flawed at best. In this post, we’ll learn how simplified access to critical data can help you boost learner outcomes and fine-tune your CME management model for continued success.
CME Data Collection and Management: Your Biggest Headache is Also Your Greatest Resource
Course data is like a map. It allows you to see where your CME program is headed— whether it is further towards or further away from your educational mission. It also shows you how you happened to arrive in this particular spot on your journey towards meeting your goals. Recent and historical learner behavior data is a goldmine of insights on everything from LMS usability to learner outcomes, but you can’t use what you can’t find. Without easy access to critical program data, you’re facing weeks—if not months—of resource-intensive effort to compile the information that you need to make an accurate assessment of your program’s performance.
It isn’t just that CME data collection and management can drain program resources when performed manually, it can also be fraught with errors. If learner outcomes aren’t what you’ve hoped, then time is a resource that you can’t afford to spend unnecessarily.
Thankfully, you don’t have to. Before we tell you why getting your hands on the right CME data doesn’t have to become a Masterpiece Theatre-worthy drama, let’s define exactly what you should be looking for.
When reviewing your CME program’s performance, you need the most up-to-date information on your students, past and present. Why past data as well? Because the students who left your program early may have something in common with the ones who are at risk of dropping out now. A history of poor scores by a majority of learners in a particular course may indicate that the curriculum may be overdue for a redesign. Course data reveals the most important component of CME success: the educational impact of your programming, learner by learner. Here are just some of the course datasets that you’ll need to examine:
Completion rates by activity
If students are leaving a course after successfully completing earlier activities, you may have a curriculum design issue—one that is significant enough to discourage high-achievers from earning their credits.
Completion rates by area of expertise and years of professional experience
If inexperienced and experienced learners are achieving the same positive results on assessments and still failing to complete the course, the content may not be sufficiently challenging to engage your students.
Historical learner assessment statistics
If learner assessment results remain flat from the time that a student begins their course to its midpoint or beyond, this may signify that your content is providing only limited educational value to your students.
Real-time learner assessment statistics
It isn’t enough to view learner outcomes from the perspective of the recent past. If you’ve made, or are planning to make, changes in your curriculum, or if you’ve experienced changes (positive or negative) in course completion rates, then you’ll also want to find out what your learners are experiencing on your CME platform as it happens.
There’s no doubt that this is a tall order, but there’s no way around it. You can’t afford to wait until after a course is done to find the pain points in an activity or the user-experience issue that is causing your learners to underperform.
As we said, getting the right data into your hands doesn’t have to entail a heroic quest (although, if you get this right, your association may very well call you a hero). If you’re trying to manage all of this manually, then you’re possibly in for a very long battle with many, many spreadsheets and more than a few unwieldy databases. You’ll also be dealing with the prospect of a human error that could corrupt all of your findings and force you to start over once your work appears done. You may also face an ever-widening gap between the amount of time that your team can devote to data wrangling and the amount of data being generated as your program grows.
Using a Software as a Service (SaaS) platform to handle your data would allow you to focus on identifying the root causes of lackluster educational outcomes. But many SaaS platforms just warehouse your data and nothing more. EthosCE Analysis, which comes bundled with the EthosCE CME management platform, does all of the heavy lifting for you. EthosCE Analysis automates data collection and management, giving you instant access to historical and real-time statistics on everything from learner assessments to post-activity learner feedback.
Nonetheless, once you have the data you need, you’ll still have to find a way to transform those numbers into actionable insights. That’s yet another tall order but there’s a solution in the next paragraph.
Data, Data, Everywhere: How to Get Ahead of the CME Data Flood
To find out what’s influencing your learner outcomes, you’ll need to uncover specific patterns within your data. For that, you’ll need a bird’s eye view of everything. The best way to get the full view of your data is with a visualization. Why? Because a data visualization is a two-in-one solution for interpreting and sharing data across your organization.
With EthosCE Analysis, data visualization is not just an infographic—it is a roadmap that leads from insights to solutions, providing you with relevant metrics from every level of your CME program.
EthosCE Analysis data visualizations are auto-generated, deep-dive visual reports—showing historical and real-time data in a format that can be easily understood and distributed across the organization with one click.
What a Professional CME Data Visualization Looks Like
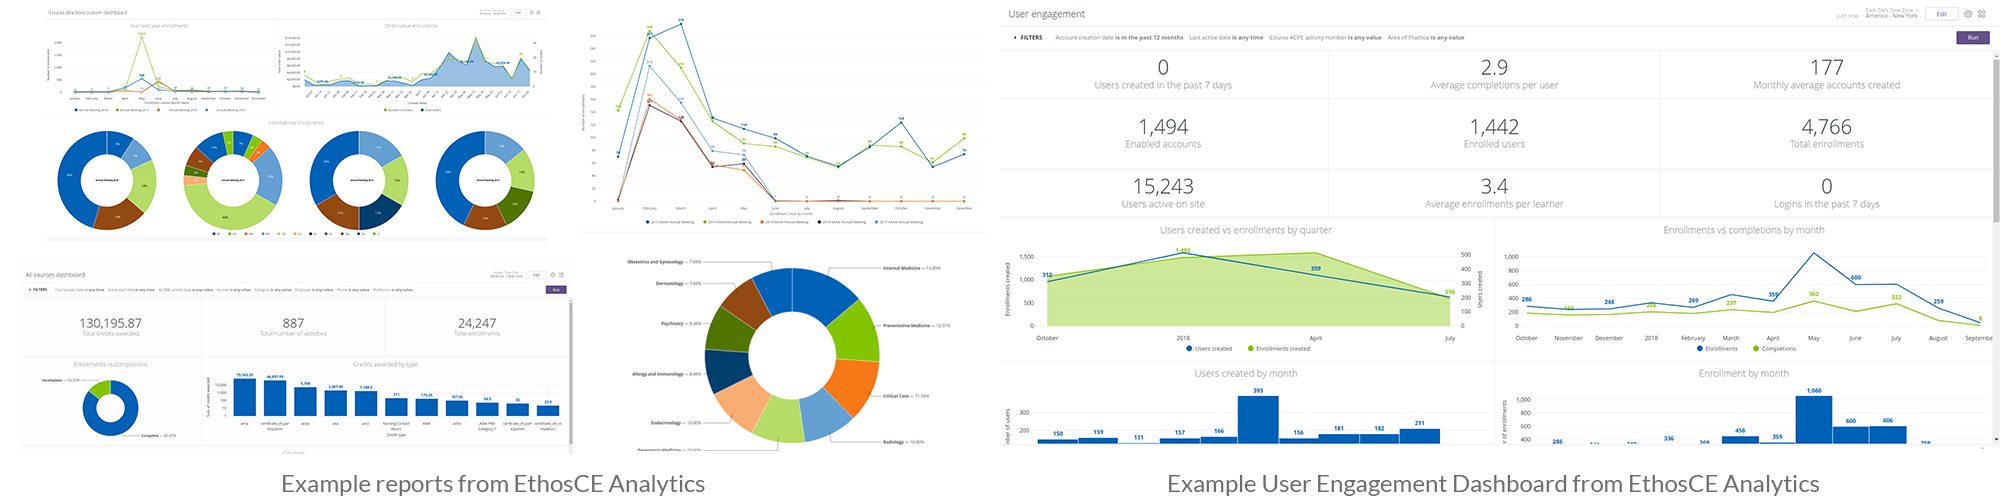
EthosCE Analysis customizable dashboards allow you to monitor and segment fresh data, review historical insights, and generate reports effortlessly.
Using your dashboard, you can review post-activity learner assessments from the past month, for example, and identify learners with consistently poor scores. You can even drill down and determine which activity content is causing learners to perform poorly on their assessments and adjust upcoming activities via the LMS to reinforce critical concepts.
Your dashboard isn’t limited to just learner assessment data either. Demographic information, LMS platform use statistics, and a range of other data sets can be displayed in the dashboard and transformed with a few clicks into a customizable report.
You could attempt to do all of this manually, of course. If you do decide to take up the challenge, bear in mind the following:
Access to up-to-date and historical data is the first step in assessing the reasons behind flagging or static learner outcomes.
Without the benefit of accurate historical and real-time learner outcomes data, your efforts to develop an action plan to improve your CME program’s performance will be based on guesswork. As creating and sharing comprehensive learner analytics reports (with historical and recent metrics included) takes considerable time, your team will be spinning their wheels as your program continues to produce less than optimal results.
Managing and interpreting data may become an increasingly time and resource intensive task as your program grows.
More learners equal an increasing amount of data. Without an automated system to collect, warehouse, and interpret critical learner data, you may be forced to come up with quick interpretations of whatever data you have on hand in the hope of quickly reversing a downward learner performance trend. That means that one of the key components of ACCME standards compliance—showing improved learner outcomes—will be left to chance.
That probably doesn’t sound appealing. Fortunately, you have a simple solution right in front of you. The EthosCE Analysis suite is a standard feature of the EthosCE platform, an enterprise-grade SaaS that was designed to make your life as a CME director easier. Our platform includes a robust LMS with numerous features that make it simple to adjust your curriculum to stoke learner engagement and boost educational outcomes. You’ll be able to glean insights from your EthosCE Analysis dashboard and put them into action in minutes. Intrigued? Connect with us to see how it all works.
Submit your request for an exclusive 1-on-1 live demonstration of the EthosCE Learning Management System and discover how you can attain actionable CME data, fast.